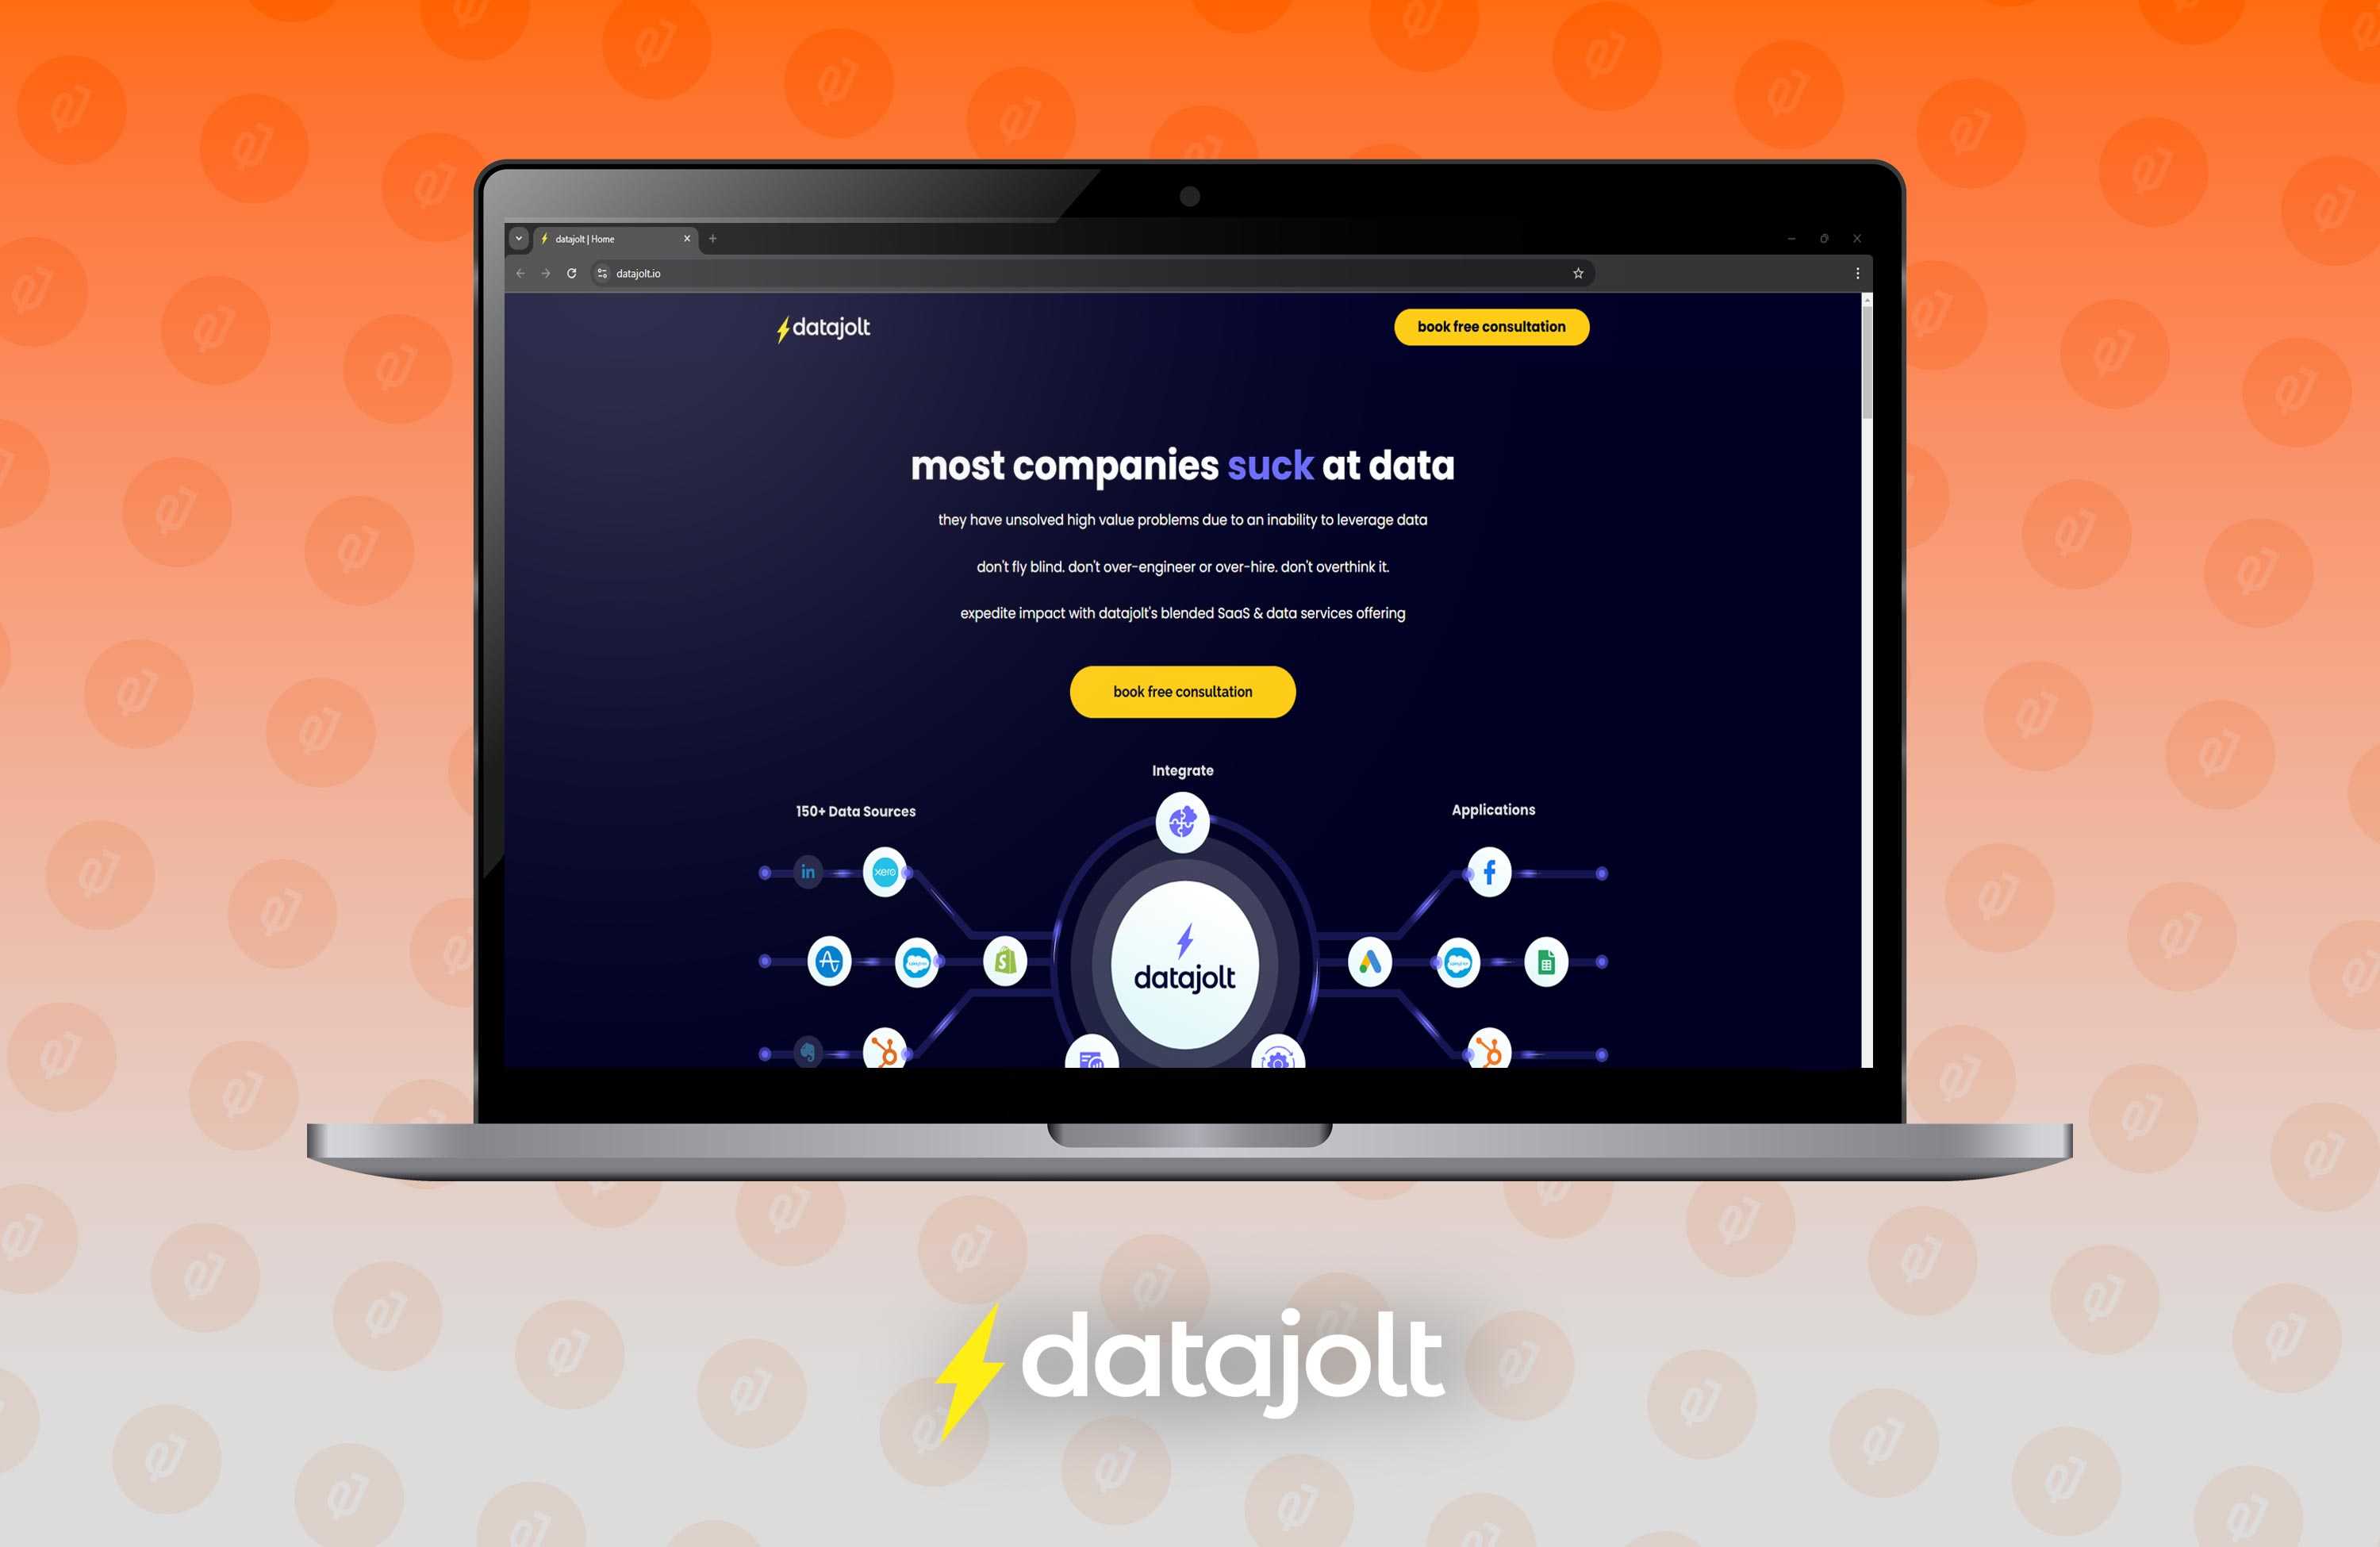
Datajolt
A product-grade dashboard that turns data complexity into decision-making clarity.
01. The Challenge
Data everywhere. Insight nowhere.
Datajolt's clients had data scattered across dozens of sources - CRMs, ad platforms, revenue tools - with no single view of what was actually happening. Analysts were spending more time building reports than acting on them.
The client needed a dashboard that non-technical stakeholders could use daily, while still giving analysts the power to go deep with raw SQL when needed.
02. The Solution
One Dashboard. Every Answer.
We built a React.js product dashboard with a clean, intuitive interface - a fully functional SQL editor with table joins, and multiple visualisation types. Clean information architecture means anyone can find what they need in under 30 seconds.
SQL Editor
Full-power editor with table joins, autocomplete, and instant previews.
Visual Analytics
Graphs, tables, and summary cards built for non-technical stakeholders.
Engineered Core
150+
Data sources integrated at launch
40%
Faster time-to-insight for analysts
03. The Impact
"They're smart, professional, and understand customer requirements perfectly."
150+
Data sources integrated at launch
40%
Faster time-to-insight for analysts
99.9%
Uptime across the first year
Ready to engineer your unfair advantage?
Let's build something that doesn't just work, but wins.